2012년 11월 29일 목요일

Tautomerism of aromatic compounds

Keto-Enol Tautomerism: Key Points

Aldehydes and ketones are  somewhat lycanthropic chemical species.  Take acetone. It behaves as a garden-variety polar aprotic solvent, which makes it a useful medium for SN2 reactions;  it reacts readily with nucleophiles like enolates, Grignards, and amines; and is several pKa units less acidic than alcohols (~20 vs. 16). This chemical behavior reflects the fact that it spends the vast majority of its time as a ketone, with an electrophilic carbonyl carbon. It’s nice and stable. You use it to wash glassware with, or as paint thinner.


But every couple of blue moons (for acetone in water about 1/6600 th of the time at 23 °C) acetone undergoes a transformation to its alter ego, the enol form. [EDIT: equilibrium constant is 1 x 10^-8 in water) And as its name suggests, the enol form – which is an isomer, not a resonance form – has the characteristics of both alkenes and alcohols: it can involve itself in hydrogen bonding via the OH group, it is acidic at oxygen, and it reacts with electrophiles (like aldehydes, for example, in the Aldol reaction). In short, the enol form differs from the keto form in its polarity, acidity, and nucleophilicity just like werewolves differ from ordinary folks in their copious body hair, nocturnal rambunctiousness, and peculiar dietary habits.
The reason for the equilibrium lying to the left is due to bond energies. The keto form has a C–H, C–C, and C=O bond whereas the enol has a C=C, C–O an O–H bond. The sum of the first three is about 359 kcal/mol (1500 kJ/mol) and the second three is 347 kcal/mol (1452 kJ/mol). The keto form is therefore more thermodynamically stable by 12 kcal/mol (48 kJ/mol).
Although the keto form is most stable for aldehydes and ketones in most situations, there are several factors that will shift the equilibrium toward the enol form.  The same factors that stabilize alkenes or alcohols will also stabilize the enol form. There are two strong factors and three subtle factors.
Biggies (2):
1. Aromaticity.  Phenols can theoretically exist in their keto forms, but the enol form is greatly favored due to aromatic stabilization.
2. Hydrogen Bonding. Nearby hydrogen bond acceptors stabilize the enol form. When a Lewis basic group is nearby, the enol form is stabilized by internal hydrogen bonding.

Here are three more subtle effects in keto-enol tautomerism:
3. Solvent. Solvent can also play an important role in the relative stability of the enol form. For example, in benzene, the enol form of 2,4-pentanedione predominates in a 94:6 ratio over the keto form, whereas the numbers almost reverse completely in water. What’s going on? In a polar protic solvent like water, the lone pairs will be involved in hydrogen bonding with the solvent, making them less available to hydrogen bond with the enol form.
 4. Conjugation . π systems are a little like Cheerios in milk: given the choice, they want to connect together than hang out in isolation.  So in the molecule depicted, the more favorable tautomer will be the one on the left, where the double bond is a connected by conjugation to the phenyl.
 5. Substitution. In the absence of steric factors, increasing substitution at carbon will stabilize the enol form. Enols are alkenes too – so any factors that stabilize alkenes, will stabilize enols as well. All else being equal, double bonds increase in thermodynamic stability as substitution is increased. So in the above example, the enol on the left should be the more stable one. As you might suspect, “all things being equal” sounds like a big caveat. It is - all else is rarely equal. But that’s a topic for another day – or, more likely, another course.
 

Sources: “March’s Advanced Organic Chemistry”, “Solvents and solvent effects in Organic Chemistry”, by Christian Riechart. EDIT: Commenter Natalia helpfully points out that Carey & Sundberg A is a great resource for this topic (section 7.3 in my 4th edition) and she is right.

2012년 11월 27일 화요일

spin-spin interaction

http://www2.chemistry.msu.edu/faculty/reusch/VirtTxtJml/Spectrpy/nmr/nmr1.htm


5.5A: The source of spin-spin coupling
The 1H-NMR spectra that we have seen so far (of methyl acetate and para-xylene) are somewhat unusual in the sense that in both of these molecules, each set of protons generates a single NMR signal.  In fact, the 1H-NMR spectra of most organic  molecules contain proton signals that are 'split' into two or more sub-peaks.  Rather than being a complication, however, this splitting behavior actually provides us with more information about our sample molecule. 
Consider the spectrum for 1,1,2-trichloroethane.  In this and in many spectra to follow, we show enlargements of individual signals so that the signal splitting patterns are recognizable.
image058.png
The signal at 3.96 ppm, corresponding to the two Ha protons, is split into two subpeaks of equal height (and area) – this is referred to as a doublet.  The Hb signal at 5.76 ppm, on the other hand, is split into three sub-peaks, with the middle peak higher than the two outside peaks - if we were to integrate each subpeak, we would see that the area under the middle peak is twice that of each of the outside peaks.  This is called a triplet.
The source of signal splitting is a phenomenon called spin-spin coupling, a term that describes the magnetic interactions between neighboring, non-equivalent NMR-active nuclei. In our 1,1,2 trichloromethane example, the Ha and Hb protons are spin-coupled to each other. Here's how it works, looking first at the Ha signal: in addition to being shielded by nearby valence electrons, each of the Ha protons is also influenced by the small magnetic field generated by Hb next door (remember, each spinning proton is like a tiny magnet). The magnetic moment of Hb will be aligned with B0 in (slightly more than) half of the molecules in the sample, while in the remaining half of the molecules it will be opposed to B0.  The Beff ‘felt’ by Ha is a slightly weaker if Hb is aligned against B0, or slightly stronger if Hb is aligned with B0.  In other words, in half of the molecules Ha is shielded by Hb (thus the NMR signal is shifted slightly upfield) and in the other half Ha is deshielded by Hb (and the NMR signal shifted slightly downfield).  What would otherwise be a single Ha peak has been split into two sub-peaks (a doublet), one upfield and one downfield of the original signal.  These ideas an be illustrated by a splitting diagram, as shown below.

image060.png

Now, let's think about the Hb signal.  The magnetic environment experienced by Hb is influenced by the fields of both neighboring Ha protons, which we will call Ha1 and Ha2.  There are four possibilities here, each of which is equally probable.  First, the magnetic fields of both Ha1 and Ha2 could be aligned with B0, which would deshield Hb, shifting its NMR signal slightly downfield.  Second, both the Ha1 and Ha2 magnetic fields could be aligned opposed to B0, which would shield Hb, shifting its resonance signal slightly upfield.  Third and fourth, Ha1 could be with B0 and Ha2 opposed, or Ha1 opposed to B0 and Ha2 with B0.  In each of the last two cases, the shielding effect of one Ha proton would cancel the deshielding effect of the other, and the chemical shift of Hb would be unchanged.
image062.png
So in the end, the signal for Hb is a triplet, with the middle peak twice as large as the two outer peaks because there are two ways that Ha1 and Ha2 can cancel each other out.
Now, consider the spectrum for ethyl acetate:
image064.png
We see an unsplit 'singlet' peak at 1.833 ppm that corresponds to the acetyl (Ha) hydrogens – this is similar to the signal for the acetate hydrogens in methyl acetate that we considered earlier.  This signal is unsplit because there are no adjacent hydrogens on the molecule.  The signal at 1.055 ppm for the Hc hydrogens is split into a triplet by the two Hb hydrogens next door.  The explanation here is the same as the explanation for the triplet peak we saw previously for 1,1,2-trichloroethane.
The Hb hydrogens give rise to a quartet signal at 3.915 ppm – notice that the two middle peaks are taller then the two outside peaks.  This splitting pattern results from the spin-coupling effect of the three Hc hydrogens next door, and can be explained by an analysis similar to that which we used to explain the doublet and triplet patterns.
Example
Exercise 5.6:
a) Explain, using left and right arrows to illustrate the possible combinations of  nuclear spin states for the Hc hydrogens, why the Hb signal in ethyl acetate is split into a quartet. 
b) The integration ratio of doublets is 1:1, and of triplets is 1:2:1. What is the integration ratio of the Hb quartet in ethyl acetate? (Hint – use the illustration that you drew in part a to answer this question.)

By now, you probably have recognized the pattern which is usually referred to as the n + 1 rule: if a set of hydrogens has n neighboring, non-equivalent hydrogens, it will be split into n + 1 subpeaks. Thus the two Hb hydrogens in ethyl acetate split the Hc signal into a triplet, and the three Hc hydrogens split the Hb signal into a quartet.  This is very useful information if we are trying to determine the structure of an unknown molecule: if we see a triplet signal, we know that the corresponding hydrogen or set of hydrogens has two `neighbors`.  When we begin to determine structures of unknown compounds using 1H-NMR spectral data, it will become more apparent how this kind of information can be used.
Three important points need to be emphasized here.  First, signal splitting only occurs between non-equivalent hydrogens – in other words, Ha1 in 1,1,2-trichloroethane is not split by Ha2, and vice-versa. 
image066.png

Second, splitting occurs primarily between hydrogens that are separated by three bonds.  This is why the Ha hydrogens in ethyl acetate form a singlet– the nearest hydrogen neighbors are five bonds away, too far for coupling to occur.
image068.png
Occasionally we will see four-bond and even 5-bond splitting, but in these cases the magnetic influence of one set of hydrogens on the other set is much more subtle than what we typically see in three-bond splitting (more details about how we quantify coupling interactions is provided in section 5.5B). Finally, splitting is most noticeable with hydrogens bonded to carbon.  Hydrogens that are bonded to heteroatoms (alcohol or amino hydrogens, for example) are coupled weakly - or not at all - to their neighbors.  This has to do with the fact that these protons exchange rapidly with solvent or other sample molecules.
Below are a few more examples of chemical shift and splitting pattern information for some relatively simple organic molecules. 
image070.png
image072.png

image074.png

Example
Exercise 5.7:  How many proton signals would you expect to see in the 1H-NMR spectrum of triclosan (a common antimicrobial agent found in detergents)? For each of the proton signals, predict the splitting pattern. Assume that you see only 3-bond coupling.
Exercise 5.8: Predict the splitting pattern for the 1H-NMR signals corresponding to the protons at the locations indicated by arrows (the structure is that of the neurotransmitter serotonin).
image076.png


5.5B: Coupling constants
Chemists quantify the spin-spin coupling effect using something called the coupling constant, which is abbreviated with the capital letter J.  The coupling constant is simply the difference, expressed in Hz, between two adjacent sub-peaks in a split signal.  For our doublet in the 1,1,2-trichloroethane spectrum, for example, the two subpeaks are separated by 6.1 Hz, and thus we write 3Ja-b = 6.1 Hz.
image078.png
The superscript 3 tells us that this is a three-bond coupling interaction, and the a-b subscript tells us that we are talking about coupling between Ha and Hb. Unlike the chemical shift value, the coupling constant, expressed in Hz, is the same regardless of the applied field strength of the NMR magnet.  This is because the strength of the magnetic moment of a neighboring proton, which is the source of the spin-spin coupling phenomenon, does not depend on the applied field strength.
When we look closely at the triplet signal in 1,1,2-trichloroethane, we see that the coupling constant - the `gap` between subpeaks - is 6.1 Hz, the same as for the doublet. This is an important concept!  The coupling constant 3Ja-b quantifies the magnetic interaction between the Ha and Hb hydrogen sets, and this interaction is of the same magnitude in either direction. In other words, Ha influences Hb to the same extent that Hb influences Ha. When looking at more complex NMR spectra, this idea of reciprocal coupling constants can be very helpful in identifying the coupling relationships between proton sets.
Coupling constants between proton sets on neighboring sp3-hybridized carbons is typically in the region of 6-8 Hz.  With protons bound to sp2-hybridized carbons, coupling constants can range from 0 Hz (no coupling at all) to 18 Hz, depending on the bonding arrangement. 
image080.png

For vinylic hydrogens in a trans configuration, we see coupling constants in the range of 3J = 11-18 Hz, while cis hydrogens couple in the 3J = 6-15 Hz range. The 2-bond coupling between hydrogens bound to the same alkene carbon (referred to as geminal hydrogens) is very fine, generally 5 Hz or lower.  Ortho hydrogens on a benzene ring couple at 6-10 Hz, while 4-bond coupling of up to 4 Hz is sometimes seen between meta hydrogens.
image082.png
Fine (2-3 Hz) coupling is often seen between an aldehyde proton and a three-bond neighbor.
Table 4 lists typical constant values.

5.5C: Complex coupling
In all of the examples of spin-spin coupling that we have seen so far, the observed splitting has resulted from the coupling of one set of hydrogens to just one neighboring set of hydrogens. When a set of hydrogens is coupled to two or more sets of nonequivalent neighbors, the result is a phenomenon called complex coupling. A good illustration is provided by the 1H-NMR spectrum of methyl acrylate:
image084.png

First, let's first consider the Hc signal, which is centered at 6.21 ppm.  Here is a closer look:
image086.png
With this enlargement, it becomes evident that the Hc signal is actually composed of four sub-peaks. Why is this? Hc is coupled to both Ha and Hb , but with two different coupling constants.  Once again, a splitting diagram can help us to understand what we are seeing.  Ha is trans to Hc across the double bond, and splits the Hc signal into a doublet with a coupling constant of 3Jac = 17.4 Hz. In addition, each of these Hc doublet sub-peaks is split again by Hb (geminal coupling) into two more doublets, each with a much smaller coupling constant of 2Jbc = 1.5 Hz.
image088.png
The result of this `double splitting` is a pattern referred to as a doublet of doublets, abbreviated `dd`.
The signal for Ha at 5.95 ppm is also a doublet of doublets, with coupling constants 3Jac = 17.4 Hz and 3Jab = 6.31 Hz. 
image090.png
The signal for Hb at 5.64 ppm is split into a doublet by Ha, a cis coupling with 3Jab = 10.4 Hz. Each of the resulting sub-peaks is split again by Hc, with the same geminal coupling constant 2Jbc = 1.5 Hz that we saw previously when we looked at the Hc signal.  The overall result is again a doublet of doublets, this time with the two `sub-doublets` spaced slightly closer due to the smaller coupling constant for the cis interaction.  Here is a blow-up of the actual Hb signal:
image092.png
Example
Exercise 5.9: Construct a splitting diagram for the Hb signal in the 1H-NMR  spectrum  of methyl acrylate. Show the chemical shift value for each sub-peak, expressed in Hz (assume that the resonance frequency of TMS is exactly 300 MHz).

When constructing a splitting diagram to analyze complex coupling patterns, it is usually easier to show the larger splitting first, followed by the finer splitting (although the reverse would give the same end result).
When a proton is coupled to two different neighboring proton sets with identical or very close coupling constants, the splitting pattern that emerges often appears to follow the simple `n + 1 rule` of non-complex splitting.  In the spectrum of 1,1,3-trichloropropane, for example, we would expect the signal for Hb to be split into a triplet by Ha, and again into doublets by Hc, resulting in a 'triplet of doublets'.
image094.png

Ha and Hc are not equivalent (their chemical shifts are different), but it turns out that 3Jab is very close to 3Jbc.   If we perform a splitting diagram analysis for Hb, we see that, due to the overlap of sub-peaks, the signal appears to be a quartet, and for all intents and purposes follows the n + 1 rule.
image096.png
For similar reasons, the Hc peak in the spectrum of 2-pentanone appears as a sextet, split by the five combined Hb and Hd protons. Technically, this 'sextet' could be considered to be a 'triplet of quartets' with overlapping sub-peaks.
image098.png
Example
Exercise 5.10: What splitting pattern would you expect for the signal coresponding to Hb in the molecule below? Assume that Jab ~ Jbc.  Draw a splitting diagram for this signal, and determine the relative integration values of each subpeak.
image100.png

In many cases, it is difficult to fully analyze a complex splitting pattern.  In the spectrum of toluene, for example, if we consider only 3-bond coupling we would expect the signal for Hb to be a doublet, Hd a triplet, and Hc a triplet.
image102.png
In practice, however, all three aromatic proton groups have very similar chemical shifts and their signals overlap substantially, making such detailed analysis difficult.  In this case, we would refer to the aromatic part of the spectrum as a multiplet.
When we start trying to analyze complex splitting patterns in larger molecules, we gain an appreciation for why scientists are willing to pay large sums of money (hundreds of thousands of dollars) for higher-field NMR instruments.  Quite simply, the stronger our magnet is, the more resolution we get in our spectrum.  In a 100 MHz instrument (with a magnet of approximately 2.4 Tesla field strength), the 12 ppm frequency 'window' in which we can observe proton signals is 1200 Hz wide.   In a 500 MHz (~12 Tesla) instrument, however, the window is 6000 Hz - five times wider.  In this sense, NMR instruments are like digital cameras and HDTVs: better resolution means more information and clearer pictures (and higher price tags!)
Contributors
This page viewed 13541 times
The ChemWiki has 7747 Modules.


The basis of spin couplingNuclear magnetic resonance (NMR) signals arise when nuclei absorb a certain radio frequency and are excited from one spin state to another. The exact frequency of electromagnetic radiation that the nucleus absorbs depends on the magnetic environment around the nucleus. This magnetic environment is controlled mostly by the applied field, but is also affected by the magnetic moments of nearby nuclei. Nuclei can be in one of many spin states (Figure 1), giving rise to several possible magnetic environments for the observed nucleus to resonate in. This causes the NMR signal for a nucleus to show up as a multiplet rather than a single peak. Figure 1: The different spin states of a nucleus (I = 1/2) in a magnetic field. These different states increase or decrease the effective magnetic field experienced by a nearby nucleus, allowing for two distinct signals.Figure 1 (Energy States.png)When nuclei have a spin of I = 1/2 (as with protons), they can have two possible magnetic moments and thus split a single expected NMR signal into two signals. When more than one nucleus affects the magnetic environment of the nucleus being examined, complex multiplets form as each nucleus splits the signal into two additional peaks. If those nuclei are magnetically equivalent to each other, then some of the signals overlap to form peaks with different relative intensities. The multiplet pattern can be predicted by Pascal’s triangle (Figure 2), looking at the nth row, where n = number of nuclei equivalent to each other but not equivalent to the one being examined. In this case, the number of peaks in the multiplet is equal to n + 1Figure 2: Pascal’s triangle predicts the number of peaks in a multiplet and their relative intensities.Figure 2 (Pascals Triangle.png)When there is more than one type of nucleus splitting an NMR signal, then the signal changes from a multiplet to a group of multiplets (Figure 3). This is caused by the different coupling constants associated with different types of nuclei. Each nucleus splits the NMR signal by a different width, so the peaks no longer overlap to form peaks with different relative intensities. Figure 3: The splitting tree of different types of multiplets. Figure 3 (Splitting Tree.png)When nuclei have I > 1/2, they have more than two possible magnetic moments and thus split NMR signals into more than two peaks. The number of peaks expected is 2I + 1, corresponding to the number of possible orientations of the magnetic moment. In reality however, some of these peaks may be obscured due to quadrupolar relaxation. As a result, most NMR focuses on I = 1/2 nuclei such as 1H, 13C, and 31P.Multiplets are centered around the chemical shift expected for a nucleus had its signal not been split. The total area of a multiplet corresponds to the number of nuclei resonating at the given frequency.
    Spin coupling in moleculesLooking at actual molecules raises questions about which nuclei can cause splitting to occur. First of all, it is important to realize that only nuclei with I ≠ 0 will show up in an NMR spectrum. When I = 0, there is only one possible spin state and obviously the nucleus cannot flip between states. Since the NMR signal is based on the absorption of radio frequency as a nucleus transitions from one spin state to another, I = 0 nuclei do not show up on NMR. In addition, they do not cause splitting of other NMR signals because they only have one possible magnetic moment. This simplifies NMR spectra, in particular of organic and organometallic compounds, greatly, since the majority of carbon atoms are 12C, which have I = 0.For a nucleus to cause splitting, it must be close enough to the nucleus being observed to affect its magnetic environment. The splitting technically occurs through bonds, not through space, so as a general rule, only nuclei separated by three or fewer bonds can split each other. However, even if a nucleus is close enough to another, it may not cause splitting. For splitting to occur, the nuclei must also be non-equivalent. To see how these factors affect real NMR spectra, consider the spectrum for chloroethane (Figure 4)Figure 4: The NMR spectrum for chloroethane. Adapted from A. M. Castillo, L. Patiny, and J. Wist. J. Magn. Reson., 2010, 209, 123.Figure 4 (Fig9.jpg)Notice that in Figure 4 there are two groups of peaks in the spectrum for chloroethane, a triplet and a quartet. These arise from the two different types of I ≠ 0 nuclei in the molecule, the protons on the methyl and methylene groups. The multiplet corresponding to the CH3 protons has a relative integration (peak area) of three (one for each proton) and is split by the two methylene protons (n = 2), which results in n + 1 peaks, i.e., 3 which is a triplet. The multiplet corresponding to the CH2 protons has an integration of two (one for each proton) and is split by the three methyl protons ((n = 3) which results in n + 1 peaks, i.e., 4 which is a quartet.  Each group of nuclei splits the other, so in this way, they are coupled. 
    Coupling constantsThe difference (in Hz) between the peaks of a mulitplet is called the coupling constant. It is particular to the types of nuclei that give rise to the multiplet, and is independent of the field strength of the NMR instrument used. For this reason, the coupling constant is given in Hz, not ppm. The coupling constant for many common pairs of nuclei are known (Table 1), and this can help when interpreting spectra.Table 1: Typical coupling constants for various organic structural types.
 
    Structural type
    Coupling constant (Hz)
 
 
    Fig10.jpg

    6 - 8
 
 
    Fig11.jpg

    5 - 7


Fig12.jpg

    2 - 12


Fig13.jpg

    0.5 - 3


Fig14.jpg

    12 - 15


Fig15.jpg


    12 - 18


Fig16.jpg

    7 - 12


Fig17.jpg


    0.5 - 3


Fig18.jpg

    3 - 11


Fig19.jpg

    2 - 3


Fig20.jpg


    ortho = 6 - 9; meta = 1 - 3; para = 0 - 1
 
Coupling constants are sometimes written nJ to denote the number of bonds (n) between the coupled nuclei. Alternatively, they are written as J(H-H) or JHH to indicate the coupling is between two hydrogen atoms. Thus, a coupling constant between a phosphorous atom and a hydrogen would be written as J(P-H) or JPH. Coupling constants are calculated empirically by measuring the distance between the peaks of a multiplet, and are expressed in Hz.Example 1Coupling constants may be calculated from spectra using frequency or chemical shift data.  Consider the spectrum of chloroethane shown in Figure 5 and the frequency of the peaks (collected on a 60 MHz spectrometer) given in Table 2. Figure 5: 1H NMR spectrum of chloroethane. Peak positions for labeled peaks are given in Table 2.  Figure 5 (Fig21.jpg)Table 2: Chemical shift in ppm and Hz for all peaks in the 1H NMR spectrum of chloroethane. Peak labels are given in Figure 5.
 
    Peak label
    δ (ppm)
    ν (Hz)
 
 
    a
    3.7805
    226.83
 
 
    b
    3.6628
    219.77
 
 
    c
    3.5452
    212.71
 
 
    d
    3.4275
    205.65
 
 
    e
    1.3646
    81.88
 
 
    f
    1.2470
    74.82
 
 
    g
    1.1293
    67.76
 
To determine the coupling constant for a multiplet (in this case, the quartet in  Figure 5),  the difference in frequency (ν) between each peak is calculated and the average of this value provides the coupling constant in Hz. For example using the data from Table 2:
Frequency of peak c - frequency of peak d = 212.71 Hz – 205.65 Hz = 7.06 HzFrequency of peak b - frequency of peak c = 219.77 Hz – 212.71 Hz = 7.06 HzFrequency of peak a - frequency of peak b = 226.83 Hz – 219.77 Hz = 7.06 HzAverage: 7.06 Hz
∴ J(H-H) = 7.06 HzNote: In this case the difference in frequency between each set of peaks is the same and therefore an average determination is not strictly necessary. In fact for 1st order spectra they should be the same. However, in some cases the peak picking programs used will result in small variations, and thus it is necessary to take the trouble to calculate a true average. To determine the coupling constant of the same multiplet using chemical shift data (δ), calculate the difference in ppm between each peak and average the values. Then multiply the chemical shift by the spectrometer field strength (in this case 60 MHz), in order to convert the value from ppm to Hz:Chemical shift of peak c - chemical shift of peak d = 3.5452 ppm – 3.4275 ppm = 0.1177 ppmChemical shift of peak b - chemical shift of peak c = 3.6628 ppm – 3.5452 ppm = 0.1176 ppmChemical shift of peak a - chemical shift of peak b = 3.7805 ppm – 3.6628 ppm = 0.1177 ppmAverage: 0.1176 ppmAverage difference in ppm x frequency of the NMR spectrometer = 0.1176 ppm x 60 MHz = 7.056 Hz∴ J(H-H) = 7.06 HzExercise 1
  Calculate the coupling constant for triplet in the spectrum for chloroethane (Figure 5) using the data from Table 2.SolutionUsing frequency data:

Frequency of peak f - frequency of peak g = 74.82 Hz – 67.76 Hz = 7.06 Hz

Frequency of peak e - frequency of peak f = 81.88 Hz – 74.82 Hz = 7.06 Hz

Average = 7.06 Hz

∴ J(H-H) = 7.06 Hz


Alternatively, using chemical shift data:

Chemical shift of peak f - chemical shift of peak g = 1.2470 ppm – 1.1293 ppm = 0.1177 ppm

Chemical shift of peak e - chemical shift of peak f = 1.3646 ppm – 1.2470 ppm = 0.1176 ppm

Average = 0.11765 ppm

0.11765 ppm x 60 MHz = 7.059 Hz

∴ J(H-H) = 7.06 Hz


Notice the coupling constant for this multiplet is the same as that in the example. This is to be expected since the two multiplets are coupled with each other.

2012년 11월 26일 월요일

RING-OPENING AND RING-FORMING POLYMERIZATIONS


RING-OPENING AND RING-FORMING POLYMERIZATIONS:
A POLYMER SYNTHESIS AND CHARACTERIZAION EXPERIMENT

INTRODUCTION:
Two experiments are actually combined into one through the concept of rings or cyclic structures, either in the monomer or the polymer formed. Seems a little tenuous, but these procedures are short and it does give you a different perspective on things. Background information is given on the general concepts of ring-opening and ring-forming polymerizations that includes industrial examples and mechanisms. The polymer synthesis for each type is combined with characterization by IR spectroscopy and dilute solution viscosity. The latter illustrates the polyelectrolyte effect for the charged ammonium polymer in water.
Polyamines, polyamine salts and polyamides are used commercially in a wide range of applications. These include sizing for paper and textiles; recovery and recycle of trace metal contaminates from chemical plants; and flocculation of particulate matter for water clarification. These polymers are strong complexing and chelating agents for metal salts, and such complexes have been used for a variety of catalytic applications. In addition, many of the polyamine compounds are basic catalysts in their own right or in conjunction with organic comonomers, and have been used to make a variety of synthetic chemicals.
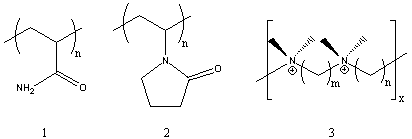
Several of the presently available commercial polymers containing amide and ammonium functionality are given in Figure 1. These included vinyl addition polymers from acrylamide (1) and N-vinylpyrrolidone (2), and step-growth polymers containing quaternary ammonium groups (polyionenes, 3) obtained from polycondensation of diamines and bishalides.
Figure 1. Commercial Amide and Ammonium Polymers.
In this experiment, we examine two major types of polymerization processes involving heterocyclic monomers or repeat units. Polymer synthesis involves ring-opening polymerization to yield a polyamide from an oxazoline, and cyclopolymerization of diallylamine derivative to yield a polymer containing pyrrolidine units.

Ring-opening polymerization mechanisms

There are several commercially important polymers which are synthesized via ring-opening polymerization. Examples summarized in Figure 2 include such common polymers as polyoxyethylene (POE, 4), poly(butylene oxide) (PBO, 5), nylon 6 (6), and poly(ethyleneimine) (PEI, 7). This last polymer is obtained by a non-selective process which can involve attack on the ethyleneimine monomer by either chain-ends or internal secondary amines of the growing polymer. These competing reactions lead to a highly branched polymer structure which contains primary, secondary and tertiary amine units.1
Figure 2. Common Ring-Opening Polymerizations.
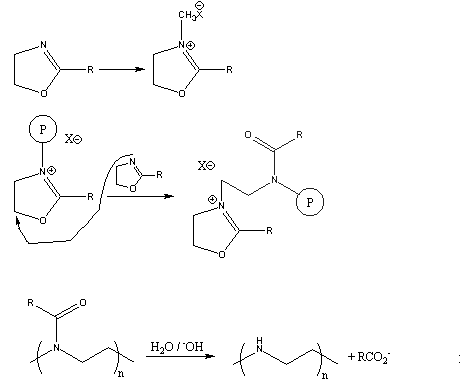
Several years ago, a novel synthesis of completely linear PEI was developed.2 The method utilized a ring-opening polymerization also, but of a 5-membered heterocycle that resulted in formation of a substituted amide rather than the free amine obtained from ethyleneimine. Figure 3 summarizes the initiation and propagation steps for this polymerization 3 as well as the hydrolysis reaction and the final polymer structure.
Figure 3. Ring-Opening Polymerization Mechanism for 2-Substituted Oxazolines
and Subsequent Polymer Hydrolysis; the Circled "P" Represents Polymer
Chain with the Indicated Active Chain End.


This method gives linear PEI (8) by a two-step process. In addition, the intermediate polymers containing amide functionality have become important in their own right.4 Many of these polymers are being examined for various unique applications involving a combination of properties. Many are soluble both in water and in a wide range of organic solvents. The amide functionality provides multiple sites for complexation and chelation of a variety of metal salts. The controlled spacing of the pendent amide derivatives along the 3-atom repeat unit in the backbone provides a novel alternative to the normal 2-atom backbone obtained with vinyl polymerization (see for example poly-(N-vinylpyrrolidone), 2). Finally, partial hydrolysis can give polymers containing both amide and amine or ammonium groups which can interact with substrates, together or in a sequential fashion.
The most common oxazoline derivative available today is the 2-ethyl compound. In this experiment, the monomer is polymerized using a cationic initiator to give high molecular weight polymer which is characterized by both IR and solubility behavior.

Cyclopolymerization

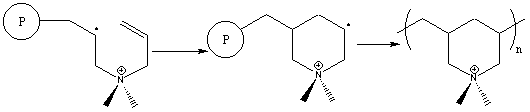
Cyclopolymerizations were first discovered by Professor George Butler in the late '50's.5 Since then, a wide variety of monomers have been found to undergo cyclopolymerization. We concentrate here on a diallylamine derivative. The cyclopolymerization process involves formation of a heterocyclic ring during polymerization as illustrated in Figure 4. The monomer shown, diallyldimethylammonium chloride, is one of the most widely used commercial derivatives.
The cyclopolymerization mechanism involves two sequential propagation steps.6 Intermolecular attack of a propagating radical is immediately followed by an intramolecular attack to form the heterocycle. Surprisingly, this second step leads to the unstable primary radical through kinetic rather than thermodynamic control, and is followed by immediate reaction with another monomer molecule. Two possible side reactions can occur in these polymerizations, involving crosslinking and chain transfer, but they are not observed. In general, cyclopolymerization of diallylammonium compounds proceeds cleanly to high molecular weight with no crosslinking.
Figure 4. Free Radical Cyclopolymerization Mechanism of a Diallylammonium Monomer

Figure 5. Free Radical Cyclopolymerization Alternate Mechanism of a Diallylammonium Monomer.

One of the earlier drawbacks in such polymerizations involved the use of peroxide initiators. Extensive yellowing of the product polymer and inefficient initiation lead to low yields and undesirable properties. A recently reported improvement on these polymerizations involves a new commercial initiator V-50 (2,2'-azobis(2-amidinopropane . 2HCl, 9). This water-soluble species cleanly forms carbon radicals that initiate diallylammonium cyclopolymerization to high yield.7
In this experiment, the polymerizability of diallyldimethylammonium chloride is examined. The polymer is purified by precipitation from water and characterized by dilute solution viscosity.

EXPERIMENTAL:

Polymerization of 2-Ethyloxazoline A clean, dry test tube is fitted with a rubber septum fastened on with wire. Approximately 2 ml of 2-ethyloxazoline8 is injected into the test tube which is then suspended in an oil bath preheated to 120oC. After a few minutes equilibration, the test tube is carefully removed and approximately 5ml of dimethylsulfate8 is injected. The test tube is put back in the oil bath. The solution gradually becomes more viscous until it gels or solidifies (about 2 h). The test tube is removed from the oil bath and allowed to cool. After removing the septum, 5 ml of methylene chloride is added to dissolve the mixture. This solution is then poured slowly into 50 ml of rapidly stirring mixed hexanes. The solvent is carefully decanted from the solid polymer which is washed again with more hexanes and finally isolated by filtration. CAUTION: dimethylsulfate is toxic and should be handled only in small quantities with good ventilation. Polymerization of Diallyldimethylammonium Chloride
Commercial monomer is usually available at 65 wt-% solution in water.9 This is suitable for direct polymerization. Approximately 5 ml of this solution is added to a test tube along with initiator 9 (V-509, about 0.05 g, ca. 1 mol-%). A septum cap is wired in place and the reaction mixture purged for 5-10 min with N2 through inlet and outlet needles in the septum. The test tube is placed in a preheated water or oil bath at 60-65oC. A small diameter syringe needle is left in the septum to relieve pressure from liberated N2 gas. Polymerization takes place rapidly to give a gelled or solid mass within 1-2 h. The polymer is isolated by precipitation into 100 ml ethanol stirring rapidly in a 250 ml beaker. Purification can be carried out by reprecipitation from water into ethanol.

DISCUSSION:

The two synthetic procedures are straight-forward and can be carried out with a minimum of special preparations and precautions. However, dimethylsulfate is toxic. Only enough material for immediate use should be used. The polymers are important commercially and represent less well-known specialty chemicals. In addition, their synthesis introduces the student to heterocyclic compounds in the context of polymer formation.
Two synthetic extensions of the experiment are possible. One involves synthesis of a poly(diallylamine)7, a polymer that is more difficult to purify and characterize. (Diallylamine is also toxic). Alternatively, the oxazoline polymer can by hydrolyzed in refluxing aqueous acid and neutralized to obtain the free amine polymer. These two polymers can then be compared with the other amide and amine polymers made in this experiment.
Polymer characterization involves qualitative evaluation of solubility behavior, dilute solution viscosity, and IR spectroscopy. Solubility should be evaluated for common organic solvents, acetic acid, and aqueous acid and base solutions. The results can be compared with other available polymers. The students must be made aware of the importance of allowing sufficient time for dissolution and swelling to take place (5-12 h). Unlike low molecular weight materials which normally dissolve rapidly or not at all, polymers take appreciable time to untangle and move away from the solid polymer mass. This effect becomes more pronounced the higher the molecular weight of the polymer.
Dilute solution viscosity is one of the most common and useful initial characterization techniques for polymers. At the very least, a viscosity value of more than ca. 0.1 dL/g tells you that you do have a polymer. More important, qualitative comparisons are possible for polymers of the same composition; ie., increasing viscosity values correlate directly with increasing molecular weight and polymer size. Detailed procedures have been published previously for viscosity determinations.
One very interesting aspect of the viscosity behavior of poly(diallyldimethylammonium chloride) is the polyelectrolyte effect that it shows.12 While well-behaved polymers show a linear relationship with respect to concentration, polyelectrolytes usually show higher reduced viscosity with decreasing concentration. This is demonstrated in the upper plot of Figure 6 (viscosity with units of dL/g plotted against concentration in g/dL). Addition of electrolytes (NaCl) at relatively high concentrations ( > 0.5M) compensates for the polyelectrolyte effect by masking the electrostatic repulsion of cationic groups along the polymer backbone. This is shown in the lower portion of Figure 6 where plots to two different types of viscosity values10,11 for the polymer plus electrolyte show linear behavior.
IR spectroscopy is the most routine spectral characterization technique available for polymers. The formation and IR characterization of polymer thin films is facile,13 giving both qualitative14 and quantitative15 information. Figure 7 gives the spectrum of the oxazoline polymer. Functional group identification can be required of the students, although polymer spectra often display unexpected combination bands and contaminant peaks from retained solvent and reactants.

Claisen Rearrangment

Claisen Rearrangment of Aryl Allyl Ethers

the Claisen rearrangement

Reaction type : Electrocyclic reaction or sigmatropic rearrangement Summary
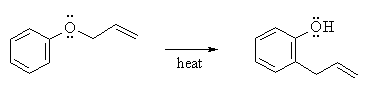
  • Aryl allyl ethers undergo a thermal rearrangement to give ortho-allylphenols.
  • This reaction is an intramolecular process.
  • A sigmatropic rearangement is a reaction is which a σ bond migrates from one end of a π system to the other.
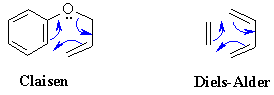
  • Note how closely the mechanism of this reaction (table below) resembles that of the Diels-Alder reaction:
    • compare the Diels-Alder and Claisen rearrangement
Caution: Do not confuse this reaction with the Claisen condensation of esters.
 
 
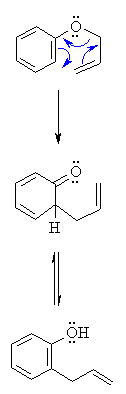
MECHANISM OF CLAISEN REARRANGEMENT 
Step 1:
An electrocyclic process. Push those electrons around the 6 membered ring.... Best appreciated by starting the electron flow by having the aromatic C=C attacking the allyl C=C and displacing an O leaving group....
Claisen rearrangement of allyl aryl ethers
Step 2:
Tautomerisation of the ketone (actually a dienone) to the more stable aromatic enol, the phenol.

2012년 11월 25일 일요일

anhydrous diethyl ether

The Grignard Reaction:  Preparation of Benzoic Acid

Prior reading: Bruice, Chapter 12, section 12.11

Prelab Exercise
Prepare a flow sheet for the preparation of benzoic acid.  Through knowledge of the physical properties of the solvents, reactants, and products, show how the products are purified.  Indicate which layer in separations should contain the product. 


Background

In 1912, Victor Grignard received the Nobel Prize in chemistry for his work on the reaction that bears his name, a carbon-carbon bond-forming reaction by which almost any alcohol may be formed from appropriate alkyl halides and carbonyl compounds.  The Grignard reagent is easily formed by reaction of an alkyl halide, in particular a bromide, with magnesium metal in anhydrous diethyl ether. Although the reaction can be written and thought of as simply,
                                                               
it appears that the structure of the material in solution is rather more complex.  There is evidence that dialkylmagnesium is present, that is,
and that the magnesium atoms, which have the capacity to accept two electron pairs from donor molecules to achieve a four-coordinated state, are solvated by the unshared pairs of electrons on ether.  The solubility results from the solvation of the organometallic compound by the ether.  
                                                                 
Hydrocarbon solvents are not useful in the preparation of Grignard agents because they cannot solvate the product.
 
The Grignard reagent is a strong base and a strong nucleophile.  As a base, it will react with all protons that are more acidic than those found on alkenes and alkanes.  Thus Grignard reagents react readily with water, alcohols, amines, thiols, etc., to regenerate the alkane, as shown below. 
 
R-MgBr  +  H2O  ®  R-H  +  MgBrOH
 
R-MgBr  +  R’OH  ®  R-H  +  MgBrOR’
 
R-MgBr  +  R’NH2  ®  R-H  +  MgBrNHR’
 
This means that the starting material for preparing the Grignard reagent must not contain any acidic protons.  The reactants and apparatus must all be completely dry; otherwise, the reaction will not start. 
The reaction proceeds satisfactorily only if the reagent and the apparatus are scrupulously dry.  If the solvent is "wet" (i.e. contains traces of water), the Grignard reagent is destroyed as fast as it is formed.


Organometals such as Grignard reagents and the organolithiums are very widely used reagents in organic synthesis.  This experiment illustrates the method used to prepare a Grignard reagent as well as its reaction with carbon dioxide to form a carboxylic acid.
The great versatility of this reaction lies in the wide range of reactants that undergo reaction with the Grignard reagent. 


Preparation of Benzoic Acid

In the present microscale experiment we shall carry out another common type of Grignard reaction, the formation of a carboxylic acid from 1 mole of the reagent and 1 mol. of carbon dioxide, according to: 
 
C6H5MgBr  +  CO2(s)  ®  C6H5COO-MgBr+
 
The primary impurity in the present experiment is biphenyl, formed by the reaction of phenylmagnesium bromide with unreacted bromobenzene.  The most effective way to lessen this side reaction is to add the bromobenzene slowly to the reaction mixture so that it will react with the magnesium and not be present in high concentration to react with previously formed Grignard reagent.  The impurity is easily eliminated, since it is much more soluble in hydrocarbon solvents than benzoic acid.  
Subsequent acidic hydrolysis of the salt will produce benzoic acid, according to:

C6H5COO-MgBr+ +  H3O+  ®  C6H5COOH  +  H2O  +  Mg2+  +  Br-


Step 1 – Preparation of Phenylmagnesium Bromide (Phenyl Grignard Reagent)
 
• Advance Preparation: **It is imperative that all equipment and reagents be absolutely dry**. One lab period before you plan to run the reaction, you should place the glassware to be used-two reaction tubes, two short vials, and a stirring rod-can be dried in a 110 °C oven to dry, along with the magnesium turnings. Use anhydrous ether as solvent. Rinse syringe and needle in dry anhydrous ether. If it appears to be dirty, obtain an unused syringe needle and syringe from stockroom. Alternatively, if the glassware, syringe, septa, and magnesium appear to be perfectly dry, they can be used without special drying. The plastic and rubber-ware should be rinsed with anhydrous ether prior to use. Do not place plastic ware in the oven. New, sealed packages of syringes can be used without prior drying. The ether used throughout this reaction must be absolutely dry.  However, ether extractions of aqueous solutions can be carried out with the wet ether.
• Ether is extremely flammable; do not work with this solvent near flames.
• To remove ether from a septum-capped bottle, inject a volume of air into the bottle equal to the amount of ether being removed. Pull more ether than needed into the syringe, and then push the excess back into the bottle before removing the syringe. Try not to hold the syringe in your warm hands as this will cause the ether to vaporize and squirt out of the syringe. As the fluid gets lower in the bottle, the short needle may not reach the fluid.  In this case, turn the bottle upside down.
• Remove a reaction tube from the oven and immediately cap it with a septum. In the operations that follow, keep the tube capped except when it is necessary to open it. After it cools to room temperature, add about 2 mmol (about 50 mg) of magnesium turnings. Record the weight of magnesium used to the nearest milligram. We will make it the limiting reagent by using a 5% molar excess of bromobenzene (about 2.1 mmol.). (See below.)
• Using a dry syringe, add to the magnesium by injection through the septum 0.5 mL of anhydrous diethyl ether. Your laboratory instructor can demonstrate transfer from the storage container used in your laboratory.
• Into an oven-dried short vial weigh about 2.1 mmol (about 330 mg) of dry (stored over molecular sieves)
bromobenzene. Using a syringe, add to this vial 0.7 mL anhydrous diethyl ether, and immediately, with the same syringe, remove all the solution from the via l.  This can be done virtually quantitatively so you do not need to rinse the vial. Immediately cap the empty vial to keep it dry for later use. Inject about 0.1 mL of the bromobenzene-ether mixture into the reaction tube and mix the contents by flicking the tube.  Pierce the septum with another needle for pressure relief.
• Once the reaction has started, the bromobenzene-ether solution is added slowly from the syringe.  The empty needle is for pressure relief, but if condensation is complete (aided by the damp pipe cleaner), it will not be needed.  Once the reaction slows down, stir it with the magnetic stirring bar.  The solution is often turbid and gray due to impurities in the magnesium.  
 
• If the reaction does not start at this point, remove the septum, syringe, and empty syringe needle and crimp or bend the magnesium turnings with a dry stirring rod.  The magnesium metal, in the form of metallic turnings, has a coat of oxide on the outside. A fresh surface can be exposed by gently bending or crimping the turnings under the absolutely dry ether in the presence of the organic halide with a glass stirring rod.  
Be careful not to break the stirring rod.  Reaction will begin at the exposed surface, as evidenced by a slight turbidity in the solution and evolution of bubbles.  Once the exothermic reaction starts, it proceeds easily, soon begins to boil as the magnesium metal reacts with the bromobenzene to form the Grignard reagent, phenylmagnesium bromide.
• If the reaction does not start within 1 min, begin again with completely different, dry equipment (syringe, syringe needle, reaction tube, etc.).  Once the Grignard reaction starts, it will continue.  To prevent the ether from boiling away, wrap a pipe cleaner around the top part of the reaction tube.  Dampen this with water or, if the room temperature is very hot, with alcohol.
 
• To the refluxing mixture add slowly and dropwise over a period of several minutes the remainder of the solution of bromobenzene in ether at such a rate that the reaction remains under control at all times.  After all the bromobenzene solution is added, spontaneous boiling of the diluted mixture may be slow or become slow.  At this point, add a 1/2 " magnetic stirring bar to the reaction tube and stir the reaction mixture with a magnetic stirrer.  If the rate of reaction is too fast, slow down the stirrer.  The reaction is complete when none or a very small quantity of the metal remains.  Check to see that the volume of ether has not decreased.  If it has, add more anhydrous diethyl ether.  Since the solution of the Grignard reagent deteriorates on standing, the next step should be started at once.

• Step 2 - Preparation: Benzoic Acid
 
• Wipe off the surface of a small piece of dry ice with a dry towel to remove the frost, and place it in a dry 30-mL beaker. 
Use 2 mmol of the phenylmagnesium bromide you prepared in Step 1.  Remove the pressure-relief needle on the reaction tube, and then insert a syringe through the septum, turn the tube upside down, and draw into the syringe as much of reagent solution as possible.  Gently squirt this solution onto the piece of dry ice.  Then, using a clean needle, rinse out the reaction tube with 1 mL of anhydrous diethyl ether and squirt this onto the dry ice.  Allow excess dry ice to sublime. 
 
• Hydrolyze the intermediate bromo magesium salt by the addition of 2 mL of 3 M hydrochloric acid.  Cork and shake mixture thoroughly.  Two homogeneous layers of approximately equal volume should result. Add more of acid or ordinary (not anhydrous) diethyl ether if necessary.  Remove the aqueous layer.  Shake the ether layer with 1mL of water, which is removed and discarded.   Then extract the benzoic acid by adding to the ether layer 0.7 mL of 3 M sodium hydroxide solution, shaking the mixture thoroughly.  Withdraw the aqueous layer and place it in a small beaker or vial.  The extraction is repeated with another 0.5-mL portion of base and finally 0.5 mL of water.  Now that the extraction is complete, the ether, which can be discarded, contains primarily diphenyl, the byproduct formed during the preparation of the phenylmagnesium bromide.
• The combined aqueous extracts are heated gently and briefly to about 50 °C to drive off dissolved ether from the aqueous solution.  Add concentrated hydrochloric acid to make the solution acidic (test with indicator paper – the pH should be around 3-4).  Cool the mixture thoroughly in an ice bath.  Collect the benzoic acid on the Hirsch funnel, and wash it with about 1 mL of ice-cold water while on the funnel.  A few crystals of this crude material are saved for a melting-point determination, and the remainder of the product is recrystallized from boiling water.
• Recrystallization: The solubility of benzoic acid in water is 68 g/L at 95 °C and 1.7 g/L at 0 °C.  Dissolve the acid in very hot water.  Let the solution cool slowly to room temperature; then cool it in ice for several minutes before collecting the product by vacuum filtration on the Hirsch funnel.  Use the ice-cold filtrate in the filter flask to complete the transfer of benzoic acid from the reaction tube.  Turn the product out onto a piece of filter paper, squeeze out excess water, and allow it to dry thoroughly.  Once dry, weigh it, calculate the percentage yield, and determine the melting point along with the melting point of the crude material.  Obtain an IR (KBr pellet) of your product and compare it with a reference IR.  Place your product in a neatly labeled vial with your name(s) and submit to your instructor. 
 
Cleaning Up: Combine all aqueous layers, dilute with a large quantity of water, and flush the slightly acidic solution down the drain.
 
 
Post lab Questions
1. Suggest an alternate synthesis that can be used to make benzoic acid from readily available starting materials.
2. In the synthesis of benzoic acid, benzene is often detected as an impurity. How does this come about?
3. If the ethyl ether used in the Grignard reaction is wet, what byproduct would be formed?
4. The primary impurity in the present experiment is biphenyl.  Show how it is produced. 
5. Analyze the IR spectrum of benzoic acid which you obtained in the laboratory.

Optional:
6. Analyze the 13C NMR spectra of benzoic acid. 
7. Analyze the mass spectrum of bromobenzene shown below and specifically answering the following:
a) The molecular weight of bromobenzene is 157 amu.  Explain the appearance of the m/e 156 and 158 signals of about equal intensity.  b) Suggest a structure for the cation responsible for the m/e 77 signal.